
Sentiment Analysis Of Customer Reviews

Photo by Alex Motoc on Unsplash
Project Overview:
Enormous amount of data is generated on digital platforms, especially in an unstructured format and mostly in text format like Reviews, Comments, Tweets, Captions, and Posts.
It is difficult to shift through every piece of content to understand the opinion of the writer and the sentiment behind it and gather insights to make informed decisions.
That’s where the process of Sentiment Analysis comes into the picture, it helps us understand the emotion and opinion of a wider range of audience about a product or topic of interest by identifying the sentiment behind it.
The two important parts of the process of sentiment Analysis is Natural Language Processing and Machine Learning, and the sentiments are classified as Positive, Neutral and Negative.
Problem Statement:
In this project we are implementing a 3-way Sentiment Analysis of the customer reviews of the Amazon’s Grocery and Gourmet Food Platform to understand the sentiment of a wide range of reviewers about the platform. We will classify the reviews as positive, negative or neutral with the help of machine learning and preprocess our data in an unstructured text format using natural language processing.
The aim of the project is to build a classification model to classify the reviews with high accuracy. The implementation of the project is divided into the following parts, Data Collection and Cleaning, Data Preprocessing, Classification using machine learning and Model Evaluation.
Metrics:
There are Four metrics used to evaluate the peformance of the model:
- Accuracy: Gives us a measure of how often the predictions of the classifier are correct.
- (True Positives + True Negatives)/(True Positives + False Positives + True Negatives + False Negatives)
- Recall: Also called as ‘True Positive Rate’, it gives us a measure of how often the model predicted an ‘yes’ for an actual ‘yes’.
- True Positives/(True Positives + False Negatives)
- Precision: Gives us a measure of how often the model was correct when it predicted an ‘yes’.
- True Positives/(True Positives + False Positives)
- F1 Score: Gives the weighted average of Precision and Recall.
- 2(Recall Precision) / (Recall + Precision)
Analysis:
Data Exploration:
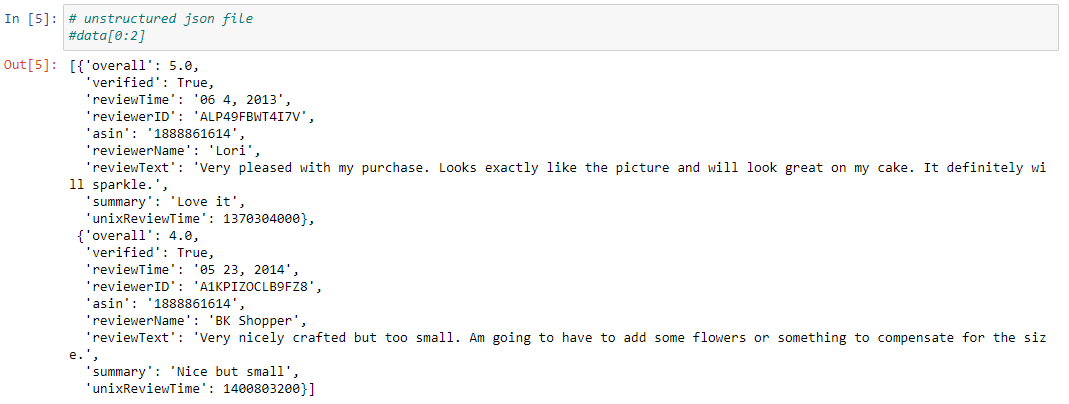
The customer reviews data of Amazon’s Grocery and Gourmet Food platform is in json format and the data is unstructured. The data has been taken from Amazon Review Data, Julian McAuley UCSD. The dataset consists of 5000 reviews with ratings on the scale of 1-5.There are around 5 million reviews, I have collected a set of 5000 reviews to implement the project.
-
Data collected in unstructured format.
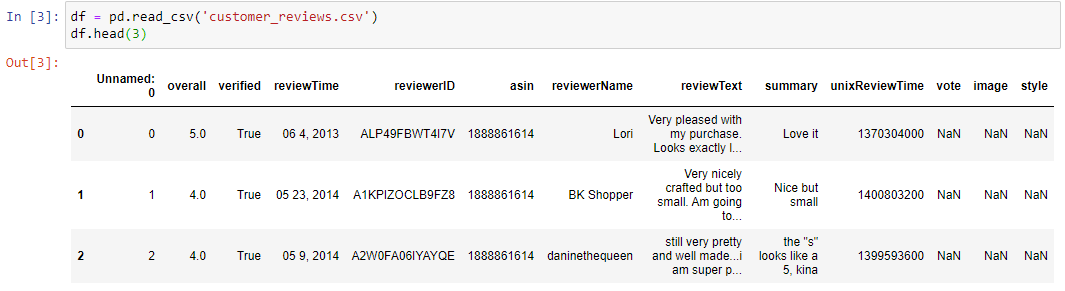
-
Created a dataframe by converting the unstructured data in a structured format and saved the data as a csv file.
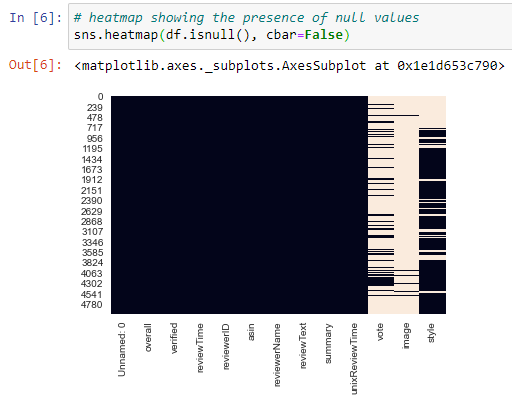
-
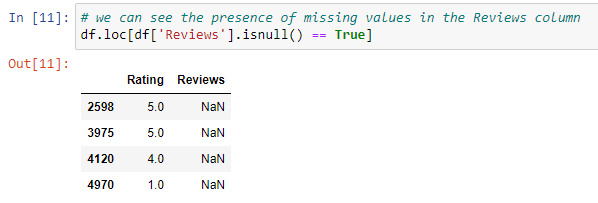
Checked for the presence missing values using a heatmap.
-
Removed the columns not relevant for our project and renamed the columns as ‘Reviews’ and ‘Rating’.
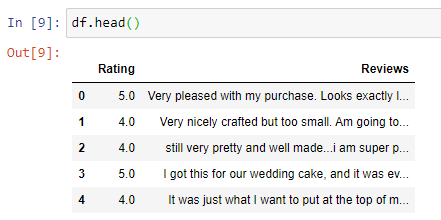
-
Dropped the rows with missing values in the ‘Reviews’ column of the dataset.
Data Visualiation:
-
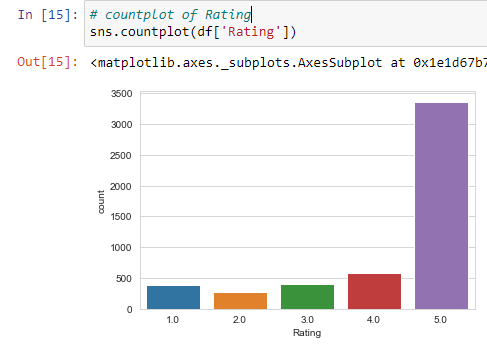
The plot shows the distribution of the Rating column of the data, we can observe that we have an imbalanced dataset.
-
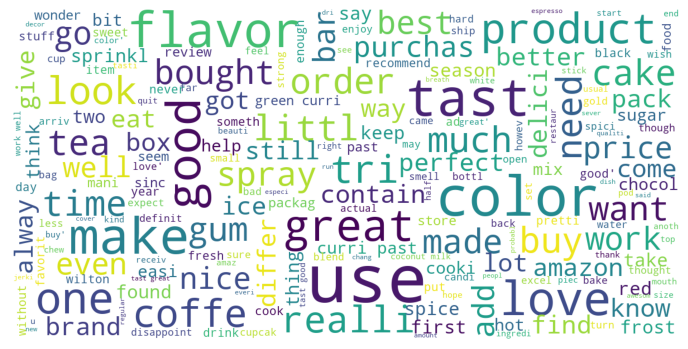
The plot shows the most repeated words in the reviews used by the reviewers.
Methodology:
Data Preprocessing:
As our data is in text format, the preprocessing step has been carried out with the help of Natural Language Processing, NLTK library. This step is done to transform the data in a format which is compatible with our machine learning model to train on.
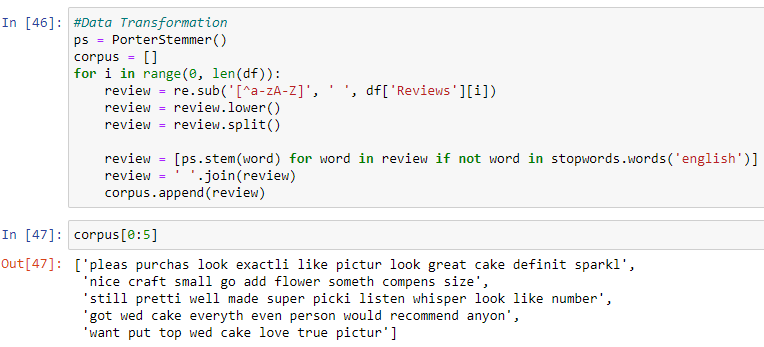
- Using the Regular Expression (re) package, substituted the special characters in our reviews with a space.
- Transformed all the characters to lowercase.
- Then split sentences to words.
- Removed stopwords and converted each word into its root form.
- Combined all the reviews and created a corpus, a list of reviews.
- Finally, converted the data into a document matrix where sentences are replaced by a vector which gives the count of each word’s occurrence in the corpus, this is referred as Bag of words.
- Then the dataset is split into a training set, which is used by our machine learning model to learn on and a test set,which is used to evaluate the performance of our model.
(Complication: when looping through each review with its index to carry out the preprocessing step, an error occured where it couldn’t find the index of the rows deleted due the missing values, fixed this error by resetting the index of the dataset)
Implementation:
The algorithms are trained using the training dataset and are evaluated by comparing the predictions of the model on the test set with the actual values of the test set.
Here, three classification algorithms have been used for training the model, Decision Trees, Support Vector Machines and Naive Bayes Classifier. The performance of all the three models is compared and the one with the highest accuracy and F1 score is selected for predictions on new data.
-
Decision Tree Classifier: The Decision Tree classifier is a supervised machine learning algorithm, it consists of nodes, branches and leaf nodes, where every node splits into leaf nodes(decision nodes) based on the levels of the feature.
-
Support Vector Machine: Support Vector Machine is a supervised machine learning algorithm and is used for both classification and Regression analysis. It produces accurate predictions with less computation power.
-
Naive Bayes Classifier: This classification algorithm is based on the Bayes’ Theorem, where every feature being classidied is independent of each other.
Refinement:
- To improve the accuracy of our prediction, we employed algorithms like Support Vector Machines and Naive Bayes Classifier along with Decision Tree classifier to compare the results and choose the best model.
Results:
Model Evaluation and Validation:
The trained models are evaluated by comparing their predictions on the test dataset with the actual values of data.
- Decision Tree Classifier:
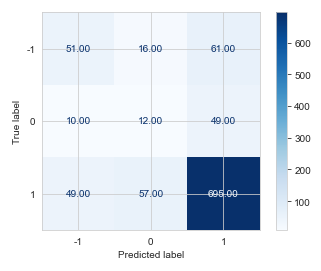
The accuracy in predictions of Decision Tree is 76%
- Support Vector Machine:
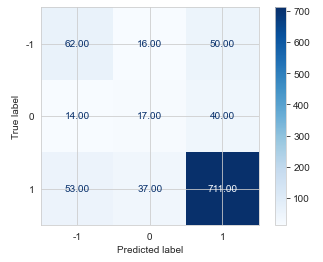
The accuracy in predictions of Support Vector Machine is 79%.
- Naive Bayes Classifier:
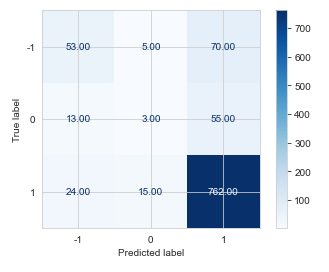
The accuracy in predictions of Naive Bayes Classifier is 82%
Justification:
- The accuracy improved from 76% to 82% with the implementation of Naive bayes Classifier. It is difficult to achieve a high accuracy and classify the reviews with high f1 score, recall and precision when the data is imbalanced, each algorithms performs well on different types of data, naive bayes algorithm performs well on datasets with both categorical features and continous features.
Conclusion:
Reflection:
- The classifier which is performing well on our data among the three is Naive Bayes Classifier with an Accuracy of 82%.
- One of the difficult aspects of the project was the transformation of text reviews into a document matrix and chosing and an appropriate algorithm for our data to fit the model.
Improvement:
This Concludes our project of Sentiment Analysis with a note that the accuracy of our models can be improved by creating a more balanced dataset.